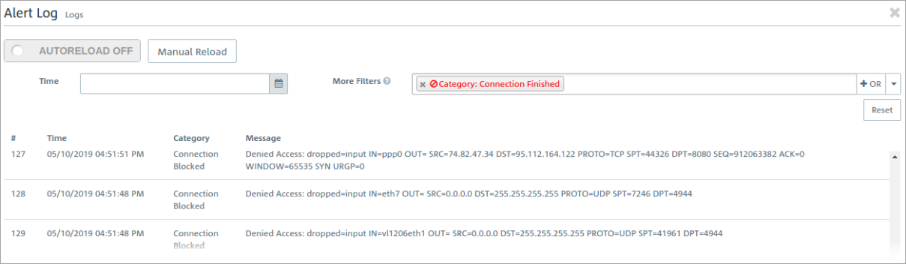
Navigate to to view the event logs for alerts and to set up display filters. In the Alert Log editing window, you can see what traffic is blocked by your LANCOM R&S®Unified Firewall or how traffic was transmitted through the firewall.
The column headers contain the following information:
| Column | Description |
|---|---|
| Time | Timestamp of the log entry. |
| Category |
Event category, which can be one of the following:
|
| Message |
The log message itself. If necessary. the |
Filtering
You can use More Filters on the input field with different search criteria and options to narrow down the results. These filters relate to the time interval that you set under Time.
Proceed as follows to create a filter:
-
Click in the input field.
The web client displays suggested filters.
Note: The available filter types, input formats and default values can be found in the Filter types table.
-
Select one of the suggested filters from the drop-down list, or enter any search text to receive further suggestions.
Note: For each suggestion, you can specify whether to use this as an inclusion filter (After selection, the suggested filter is inserted into the input field as a search criterion. The list of log messages is adapted to the search query. Matching log entries are highlighted.
 / AND) or exclusion filter (
  / AND-NOT).
Repeat the above steps until you have added the desired filter criteria to your query.
To delete a filter criterion in a search query, click on ![]() .
.
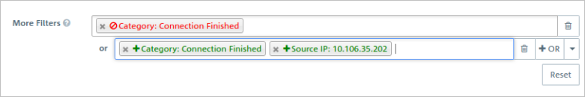
You can add multiple lines to your search by clicking on + OR next to the input field. You can choose to insert a new blank line or to copy the last created line. Each line is a separate search query, which is ORed with the other lines.
Delete the line by clicking ![]() next to the line.
next to the line.
Filter types
| Filter type | Input format | Default values | Subtypes |
|---|---|---|---|
| Text | Free text | Log entry Domain / URI (log entries from HTTP proxies, virus scanners and the URL / Content Filter) | |
| Protocol | Free text | ICMP, TCP, UDP Transport protocols or protocols detected by the Application Filter | |
| Port | Numbers from 0 to 65535 | TCP / UDP source or destination port of IPDS or firewall messages | |
| IPv4 | Valid IP address or parts thereof | Source or destination IP address of mail proxy, IDPS, application filter, or firewall messages | |
| Category | Free text or selection from the More Filters drop-down list |
|
Export
The log entries can be exported in PDF, HTML and CSV formats. The export takes into account the current filter settings.