LANmonitor is able to record various parameters of a device and to represent them graphically in the form of a curve. These include among others:
- Transmit and receive rates for WAN connections
- Transmit and receive rates for point-to-point connections
- Signal reception strength for point-to-point connections
- Link signal strength for point-to-point connections
- Throughput for point-to-point connections
- CPU load
- Free memory
- Temperature (not available on all models)
LANmonitor displays the current values of a parameter in the device overview directly in the corresponding group branch. To start the graphical display, open the context menu for a parameter and select Graph.
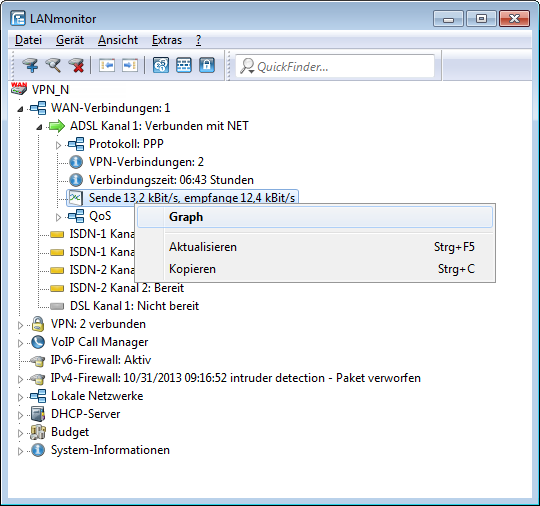
An additional window is opened, which shows variation of of the parameter over time.
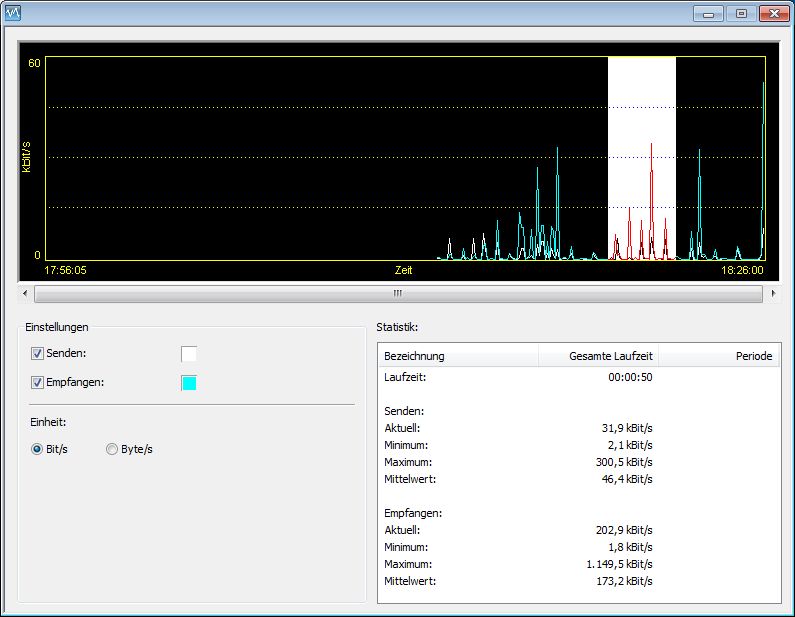
By using the left mouse button to mark a time period on the current graph, the statistics for these values are displayed separately.
Note: Please note that the values on display are deleted when the dialog is closed. For monitoring over a longer period, leave the window open. The dialog displays at most the values over the last 24 hours.