The trace function in LANmonitor exceeds the standard trace functions available from Telnet and offers greater convenience in the generation and analysis of traces. For example, the current trace configuration for activating the necessary trace commands can be stored to a configuration file. An experienced service technician can set up a trace configuration and provide it to a less experienced user for executing specialized trace requests for a device. The trace results can also be stored in a file and returned to the technician for analysis.
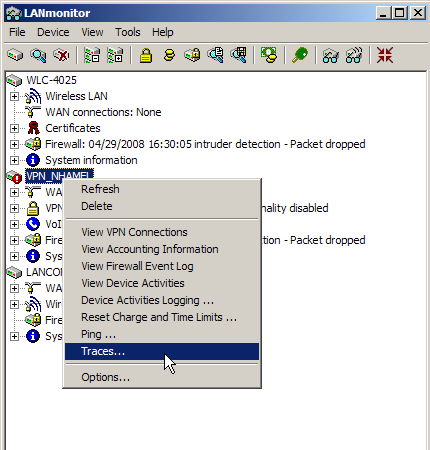
To open the trace window for a device, right-click the device entry in LANmonitor and select “Traces” from the context menu.
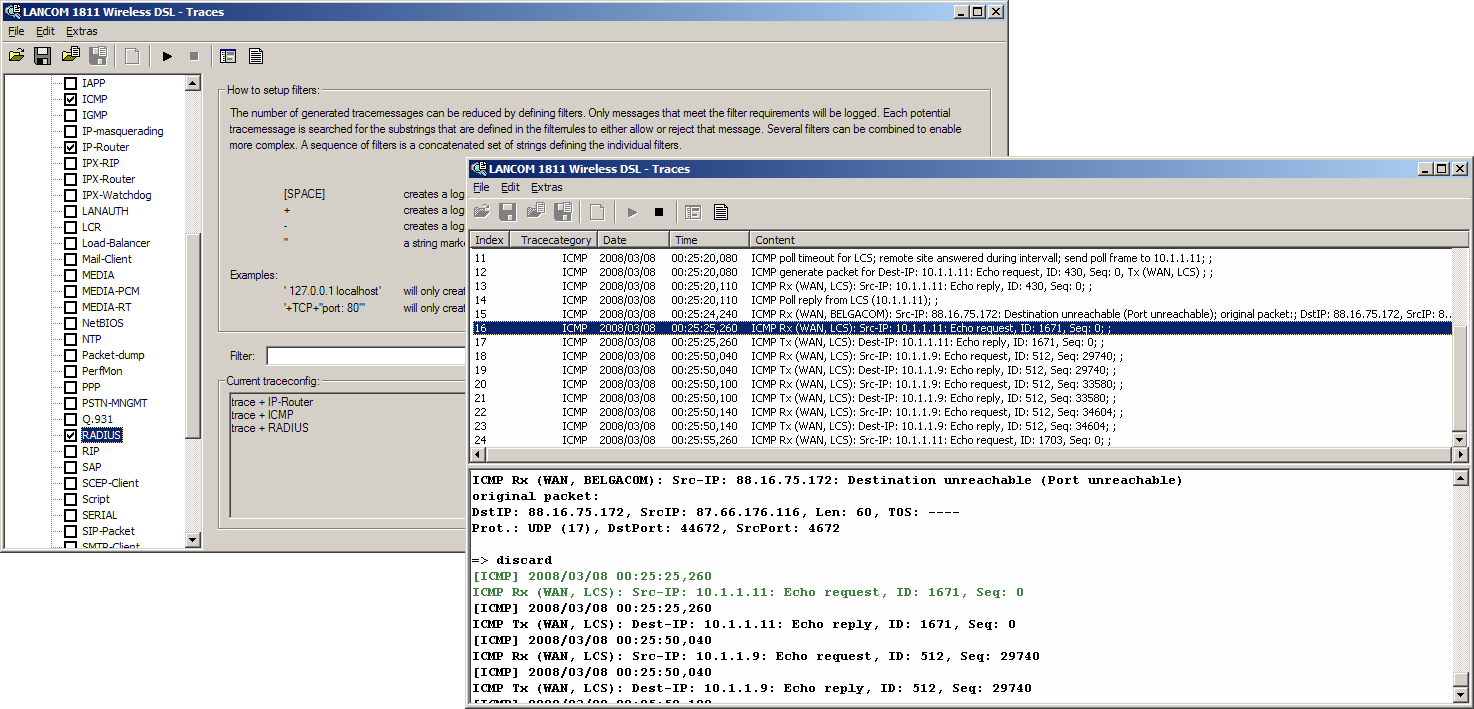
LANmonitor has the following buttons for operating the trace module:
Opens a pre-defined configuration for the trace command. This allows you to carry out trace commands precisely as required by the service technician, for example.
Stores the current trace configuration to be passed on to a user.
Opens a file with trace results for viewing in the trace module.
Saves the current trace results to a file.
Clears the current display or trace results.
Starts outputting the trace results as produced by the current configuration and automatically switches to the trace-result display mode. As soon as the trace results are returned, the other buttons are deactivated.
Stops the output of trace results.
Switches to the mode for configuring the trace output.
Switches to the mode for displaying the trace output.