The entire trace configuration is shown in the lower area of the dialog where all active Trace, Status and Show entries are listed with the respective filters and parameters.
To start the dump of the trace data, change to Display mode with the Start button.
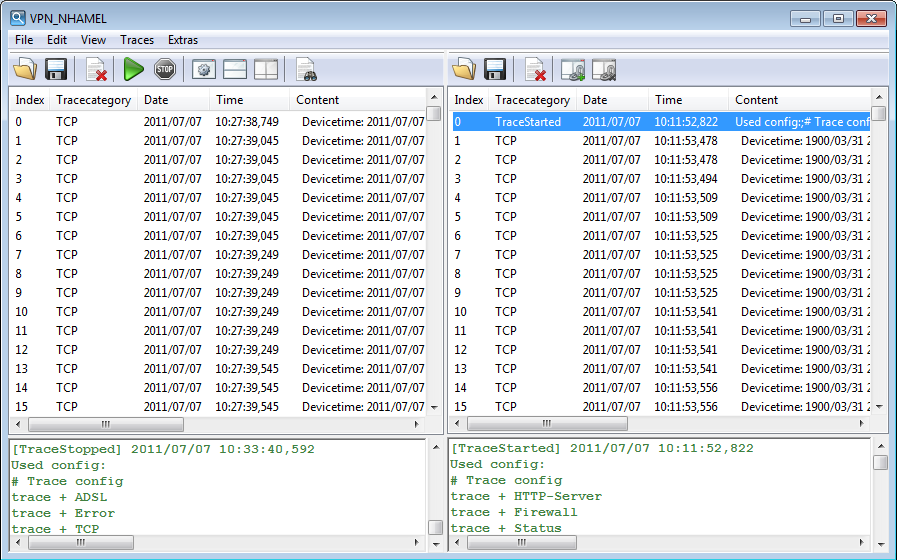
If you want to compare the results of two traces with one another, you can display two traces side by side in the split-screen mode.
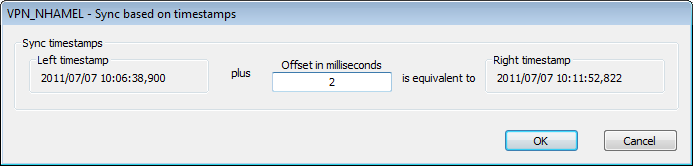
Start the time-stamp based synchronization of the two traces with the ![]() button. In the following window, enter a suitable value for the offset in milliseconds and start the synchronization.
button. In the following window, enter a suitable value for the offset in milliseconds and start the synchronization.
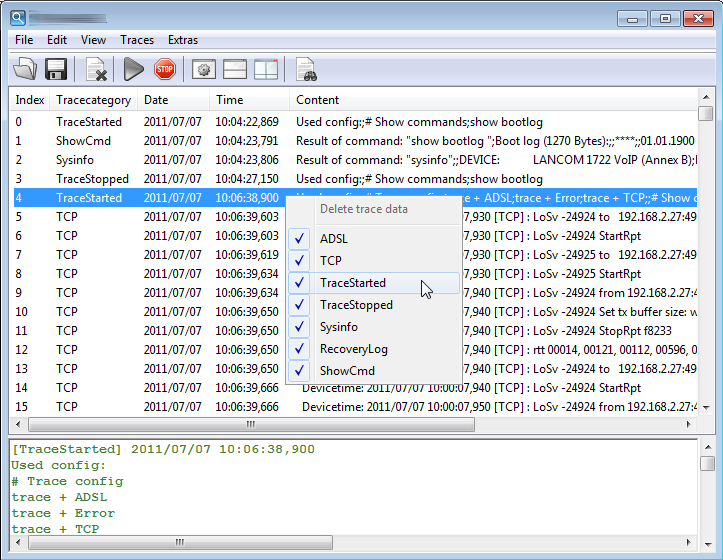
The ongoing trace dumps are displayed in this view:
- The upper section lists the results for the executed trace commands chronologically line by line.
- Since the results for a single trace command can be very long, the lower section shows a more detailed breakdown of the result selected in the upper section.
For easier navigation within long trace dumps, click a trace event in the upper area. The appropriate result is then enabled in the list and highlighted in the lower section in green. Right-clicking a trace event opens up a context menu from where individual trace results can be shown/hidden.