Going beyond the settings of the Wizard, traces and other displays can be set up precisely using the Expert Configuration. The Expert Configuration is divided into three areas:
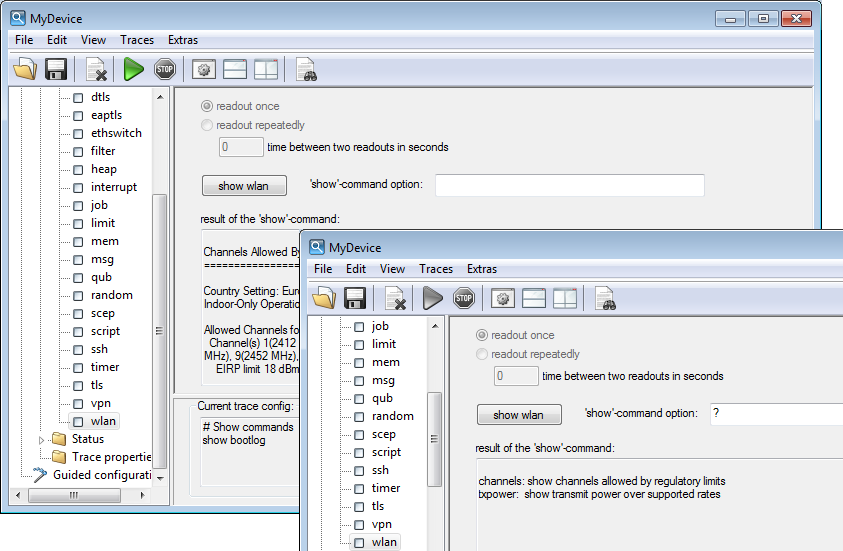
Show
Particular information can be retrieved for every device type using a Show command. Show commands are usually used on the command line (Telnet). The call of this Show command is very convenient from the graphical Windows interface in the advanced configuration of the trace. To access the current dump of the Show command, click the name of a Show command in the left-hand area of the trace dialog and then the Show button. You may have to/be able to specify additional parameters depending on the entry selected. Enter a question mark in the input field and then click the Show button for information on these parameters. To accept the dump of the Show command into the trace data, click the appropriate checkbox to the left of the entry name. For every Show command enabled, it is possible to set whether it is only run once on start of the trace or whether it is run at regular intervals (set in seconds).
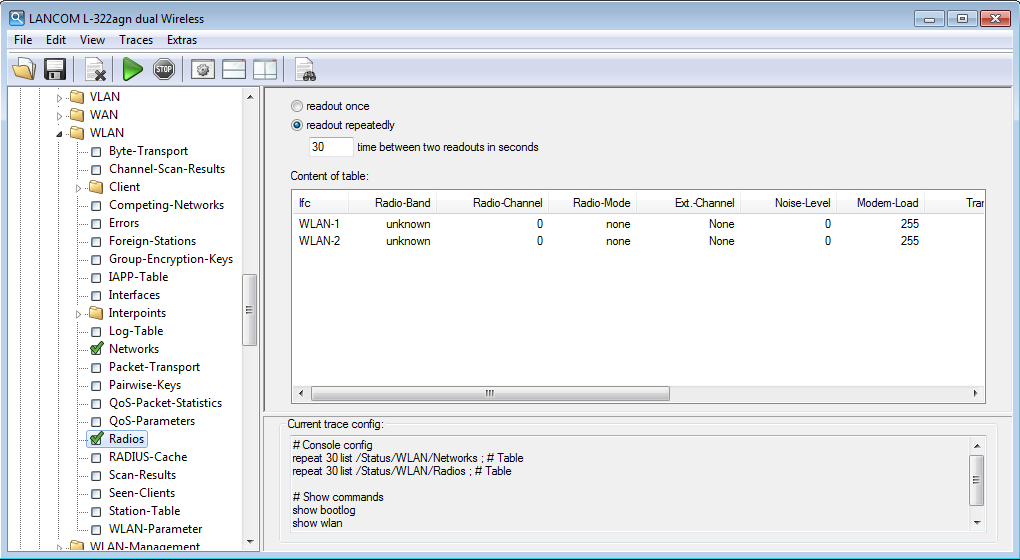
Status
Comprehensive status information and statistics on a device can be accessed from the command line (Telnet) or via WEBconfig. All available status information can also be shown via the trace dialog. Tables and individual values are shown using special icons. To display the current contents of the table or value, click the name of a status entry in the left-hand area of the trace dialogue. To accept the dump of the Status entry into the trace data, click the appropriate checkbox to the left of the entry name. For every Status entry enabled, a setting defines whether it is read out once only on starting the trace or whether it is read out at regular intervals (set in seconds).
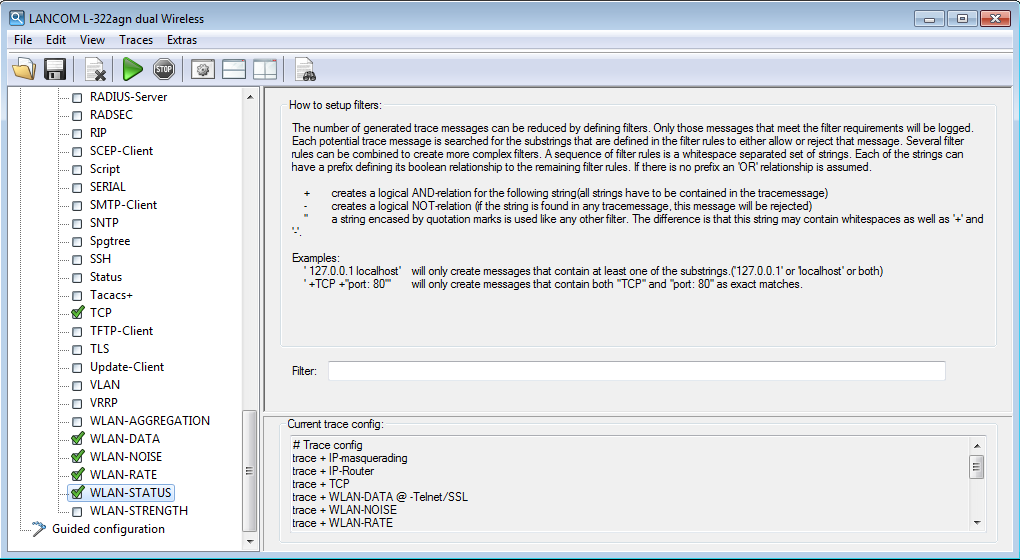
Trace settings
The traces to be dumped for the current device can be enabled in the trace settings area. To include the trace commands into the trace results, click the appropriate checkbox to the left of the entry name. A filter can be entered for every trace. For example, if you want to display only the IP traces of a particular workstation, enter the appropriate IP address as a filter of the IP router trace.