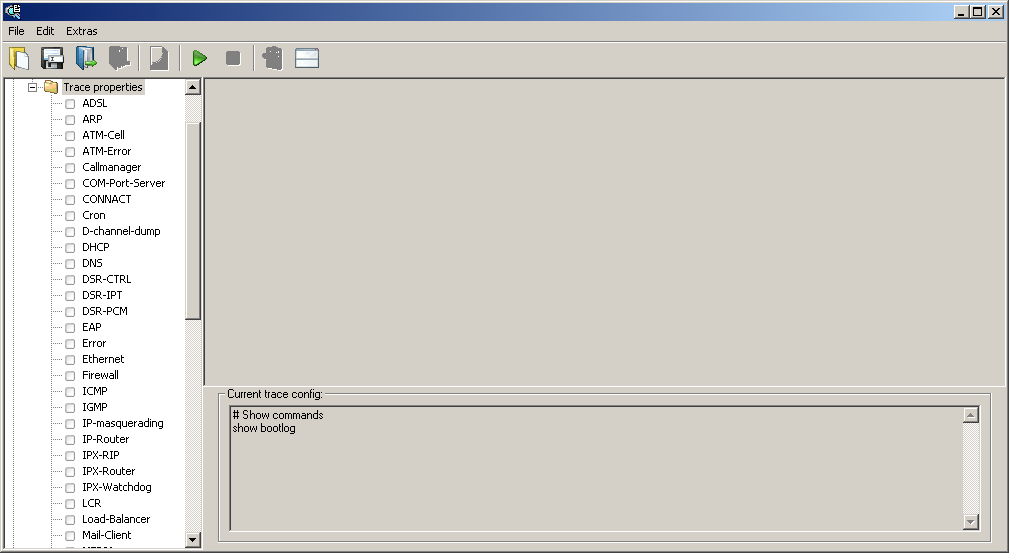
The entire trace configuration is shown in the lower area of the dialog where all active Trace, Status and Show entries are listed with the respective filters and parameters.
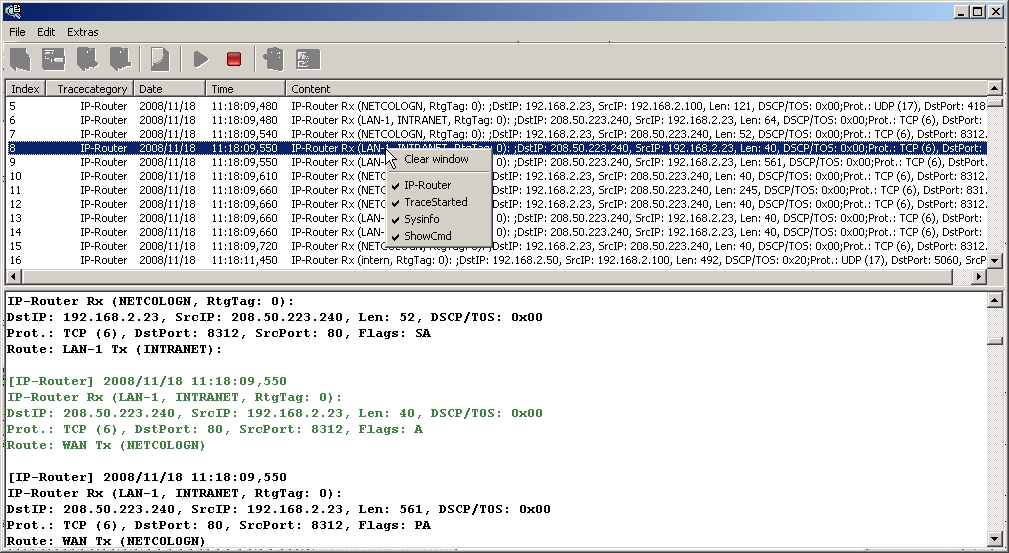
To start the dump of the trace data, change to Display mode with the Start button. The ongoing trace dumps are displayed in this view:
- The trace events are listed chronologically in the upper area.
- The lower area lists the results of the events in sequence.
For easier navigation within long trace dumps, click a trace event in the upper area. The appropriate result is then enabled in the list and highlighted green.
Right-clicking a trace event opens up a context menu from where individual trace results can be shown/hidden.
Note: Trace data is collected as long as the trace dump is enabled. To prevent overloading the
main workstation memory using LANmonitor, trace data is automatically written to a backup
file. The time intervals and the maximum size of a backup file can be set with Extras /
Other Settings / Trace backup.